How to build a storm drain inventory map
A complete walkthrough: go from an empty account to a working storm drain map your whole crew can update. You will build a point layer with inspection fields, drop drains on the map, attach photos, and share it with your team. No GIS background required, and everything here fits inside the free plan.
A storm drain inventory is one of the best first mapping projects for any public works or utility team. Every neighborhood has drains, they are easy to find and describe, and keeping track of their condition has real payoff: you can see at a glance which ones are blocked, which are due for inspection, and where problems cluster before the next heavy rain.
In this guide you will model each drain as a point on the map, attach a short inspection form to every point, and add a photo so the office can see what the crew saw in the field. By the end you will have a shared, living map instead of a spreadsheet nobody can find.
Create your free account
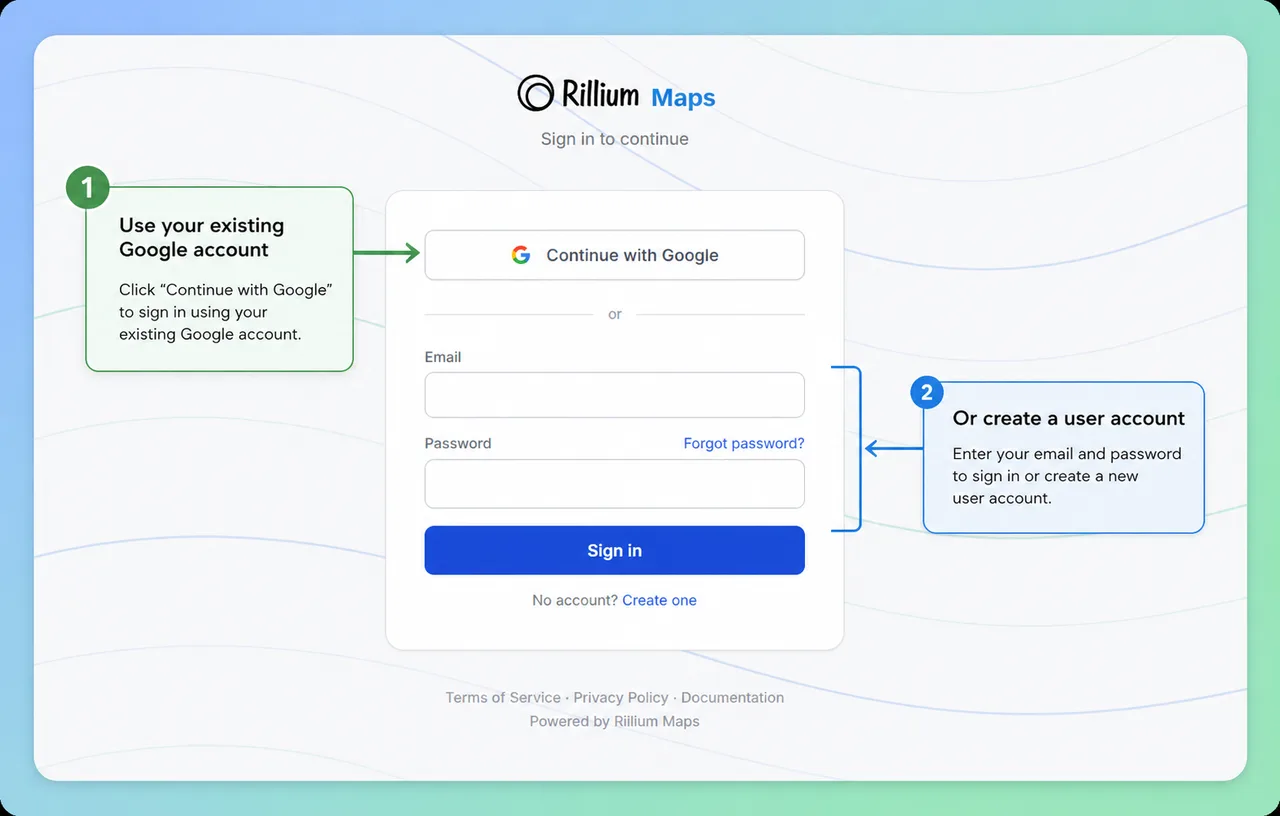
Head to map.rillium.com and sign up. You can sign in with a Google account or register with your email and a one-time PIN. There is no credit card required and nothing to install: Rillium Maps runs entirely in your browser.
Set up your organization
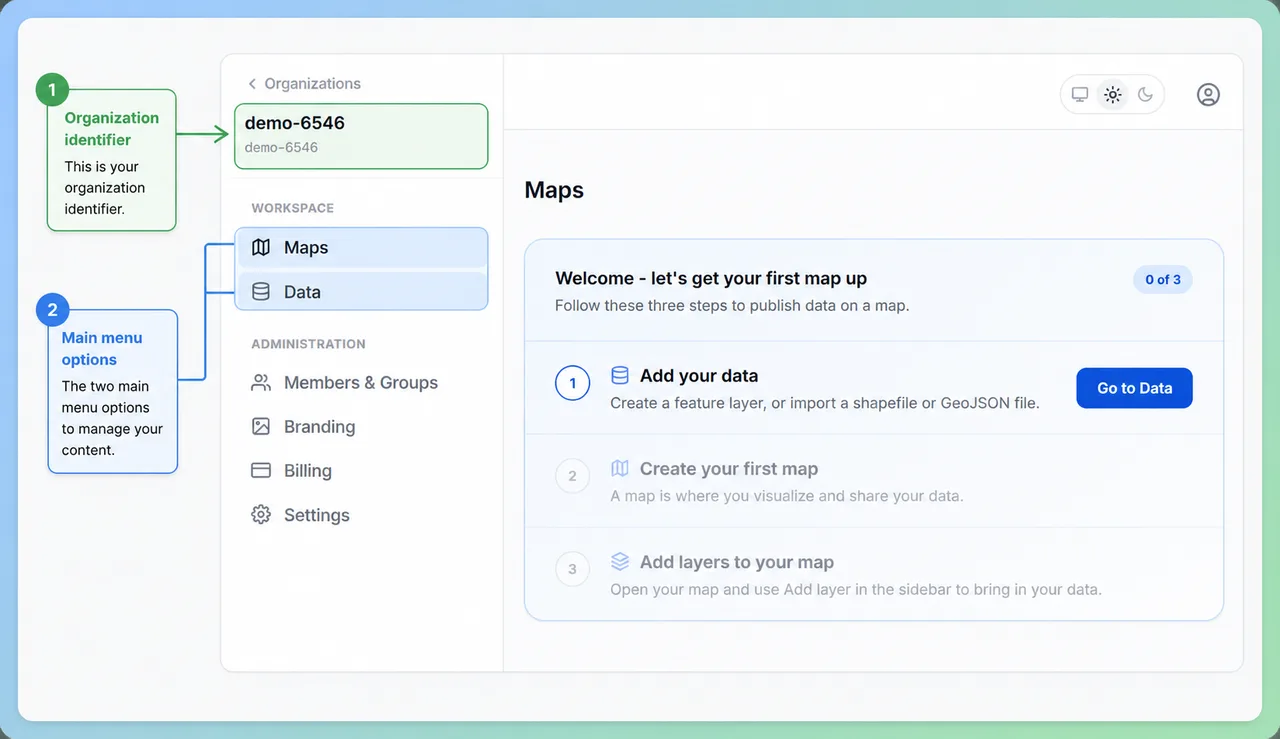
An organization is your team workspace. It holds your maps, your data, and the people you invite. If you are starting fresh, create one and give it a name your team will recognize, such as City Public Works or Greenfield Stormwater.
Once you are in your organization, you will see a left sidebar with Maps and Data. We will start in Data, because the cleanest way to build an inventory is to define the data first, then put it on a map.
Create the Storm Drains feature layer
A feature layer is your own geographic dataset: you define its shape, its fields, and who can edit it. This is where your drains will live.
- In the left sidebar, click Data.
- Click + New and choose Feature layer.
- Name it
Storm Drains. - Set the Geometry type to Point. A drain is a single location, so a point is the right shape.
Geometry type is permanent. You pick Point, Line, or Polygon once, and it cannot be changed after the layer is created. Drains are points, so this is an easy call.
Add the inspection fields
Fields are the columns of data attached to every drain. Click + Add field once for each row below. Each field has a Label (the human name shown on the form) and a Key (the machine name, generated for you). Set them up like this:
| Field label | Type | Settings |
|---|---|---|
| Condition | Dropdown | Add three options: Good, Fair, Poor. |
| Blocked | Dropdown | Add two options: No, Yes. A default of No speeds up entry. |
| Notes | Memo | Free-form text with no length limit, for anything that does not fit a field. |
Why a dropdown for Condition and Blocked?Dropdowns give everyone the same set of choices, so you never end up with “poor”, “Poor”, and “bad” meaning the same thing. Clean values now means you can filter and color your map by condition later.
About the Photo. Photos are not a field. In Rillium Maps you attach images directly to a drain from an Attachments tab, which we cover when you add your first drain. These three fields are everything you add by hand here. Every drain also gets an automatic record ID from the system, so each drain is uniquely identified for you.
When the three fields are in place, click Create feature layer. It appears in your Data list right away.
Add the layer to a map
A layer holds the data; a map is where you see and edit it. Create a map and add your layer to it.
- Click Maps in the sidebar, then New map.
- Name it
My Cityand click Create. - Open the map, click Layers in the sidebar, then + Add layer.
- Choose Storm Drains from the list.
The layer is now on your map. It is empty for the moment, which is exactly what we want before adding the first drain.
Add your first storm drain
Pan and zoom the map to a street you know. Then place a drain where it sits on the ground and fill in its inspection form, all in one flow.
- Click Edit to activate the editor.
- Click Add, then click the map at the drain’s location to place the point.
- The attribute panel opens. Fill in your three fields, for example:
- Condition: Fair
- Blocked: No
- Notes: “Minor debris around grate, cleared on site.”
- Switch to the Attachments tab to add photos and notes to the drain, as shown in the video below.
- Click Apply to attach your entries to the drain, then click Save all to commit your edits to the layer.
Your point is now a real record with data behind it. To edit a drain later, activate the editor, click the drain on the map, and its form opens again.
This really happens on your phone. Rillium Maps is built for mobile, and field data collection is where it shines: sign in on your phone and add drains right where you are standing. We show the large screen here for a clearer demo, but out in the field the phone is the tool. Try it on your phone and see.
Invite your crew
An inventory is only useful if the people doing the inspections can update it. Rillium Maps controls access with groups, and each group gets one of three roles:
| Role | Can do |
|---|---|
| Viewer | See the map and the drains, but not change anything. Good for managers and the public-facing office. |
| Editor | Add drains, edit inspection data, and attach photos. This is your field crew. |
| Admin | Everything an editor can do, plus manage members and settings. |
To get your crew in:
- Create a group, for example
Field Crew, and give it the Editor role. - Generate an invite link scoped to that group.
- Send the link to your crew. Anyone who opens it joins straight into the right group with the right access.
That is the collaboration loop: the field crew adds and updates drains on their phones, and the office sees every change live on the same map.
Take it further
You now have a working, shared storm drain inventory. When you are ready to grow it, here are the natural next moves, all available on the free plan:
Color drains by condition
Style the layer so Poor drains stand out in red and Good ones in green. A map you can read at a glance is far more useful than a list, and it makes problem areas obvious.
Filter to what matters
Filter the layer to show only blocked drains, or only drains not inspected this year. This is how you turn the inventory into a work list before a storm.
Bulk-add drains from a spreadsheet
If you already track drains in a spreadsheet, export the layer to CSV to see the format, add your rows with latitude and longitude, and import it back. Leave the ID column blank and each row becomes a new drain.
Get your data out, anytime
Download the whole layer as CSV, GeoJSON, or Shapefile whenever you want. There is no lock-in. You can also connect QGIS directly to the layer over the open OGC API and edit live, with changes saving straight back to Rillium Maps.