How to build a street sign inventory
What to record for each sign, a free spreadsheet template to record it in, and how to turn that spreadsheet into a shared map that shows which signs are due for replacement. Written for small towns and road crews with no GIS staff.
Most small towns know roughly where their signs are and have no record of how old they are. That works until a stop sign fades, someone asks when it was last replaced, and nobody can say. A sign inventory answers that question for every sign you own: where it is, what it is, what shape it is in, and when it went up.
You do not need special software to start. A spreadsheet with the six columns below is a real inventory. Putting it on a map adds two things a spreadsheet cannot do: your crew can add and update signs from a phone while standing at the post, and you can see the worn and overdue signs at a glance.
What to record for each sign
Keep it short. A form that takes 30 seconds per sign gets filled in; a form with twenty fields does not. These six cover what you need to manage replacements:
| Field | What goes in it | Why it matters |
|---|---|---|
| Sign type | Regulatory, Warning, Guide, or Other | Regulatory and warning signs come first when money is tight. |
| MUTCD code | The standard code, such as R1-1 for a stop sign | Tells you exactly what to order when it needs replacing. |
| Condition | Good, Fair, or Poor | Your work list: fading, damage, leaning posts, blocked by brush. |
| Sheeting | Engineer grade, High intensity, Diamond grade, or Unknown | Different sheeting lasts a different number of years. |
| Install date | The date on the sticker on the back, if there is one | Age is how you predict replacement before a sign fails. |
| Notes | Anything else worth knowing | “Shared post with street name sign.” |
Add the location (latitude and longitude) and a photo of each sign, and you have a complete record.
Download the sign inventory spreadsheet template (CSV). It opens in Excel or Google Sheets, has these columns ready, and includes three example rows to replace with your own.
Is a sign inventory required?
Not by name. The federal Manual on Uniform Traffic Control Devices (MUTCD) requires every agency with public roads to use an assessment or management method that keeps sign retroreflectivity, meaning how well a sign shines back in headlights at night, above minimum levels. You may choose the method: nighttime visual inspection, measuring signs with an instrument, replacing signs at the end of their expected life, replacing them all on a fixed schedule, or watching a set of control signs.
The expected sign life method is the usual fit for a small crew, and it depends on knowing when each sign was installed and what sheeting it has. That is an inventory. The Federal Highway Administration explains the rule and the methods in its sign retroreflectivity questions and answers. For how many years to expect from each sheeting type, use the manufacturer’s warranty or your state DOT’s guidance.
Create the Signs layer
Sign up at map.rillium.com and create an organization for your town or department. There is nothing to install and no credit card. Then set up the layer that will hold your signs:
- In the left sidebar, click Data.
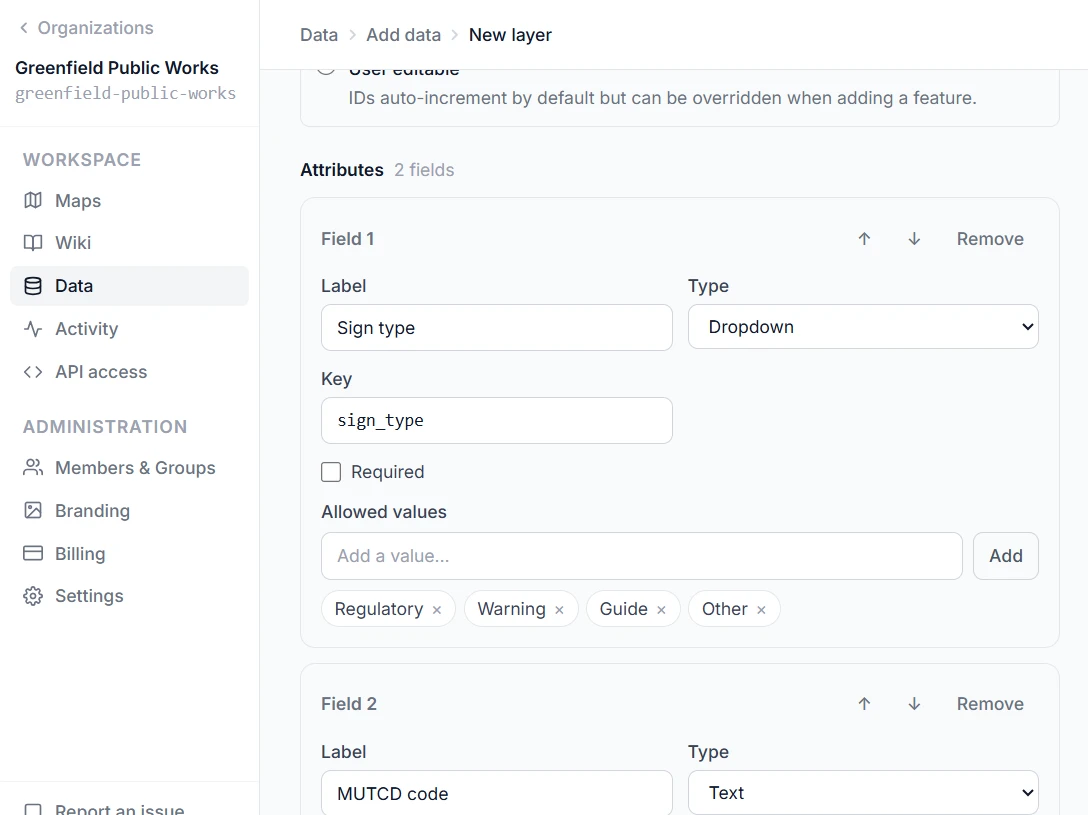
- Click + New and choose Feature layer.
- Name it
Signsand set the Geometry type to Point. - Click + Add field once for each row below.
| Field label | Type | Settings |
|---|---|---|
| Sign type | Dropdown | Allowed values: Regulatory, Warning, Guide, Other. |
| MUTCD code | Text | Short codes such as R1-1 or W1-2. |
| Condition | Dropdown | Allowed values: Good, Fair, Poor. |
| Sheeting | Dropdown | Allowed values: Engineer grade, High intensity, Diamond grade, Unknown. |
| Install date | Date | Leave it optional. Many older signs have no date. |
| Notes | Memo | Free-form text. |
Use these exact labels if you plan to import the template. Each field gets a key generated from its label (Sign type becomes sign_type), and the template’s column names match those keys. Field types and keys cannot be changed after the layer is created.
Click Create feature layer. Photos are not a field: you attach them to each sign later, from its Attachments tab.
Import the signs you already have
If you are starting from nothing, skip to the next step. If you already have signs in a spreadsheet, or you filled in the template, bring them in now:
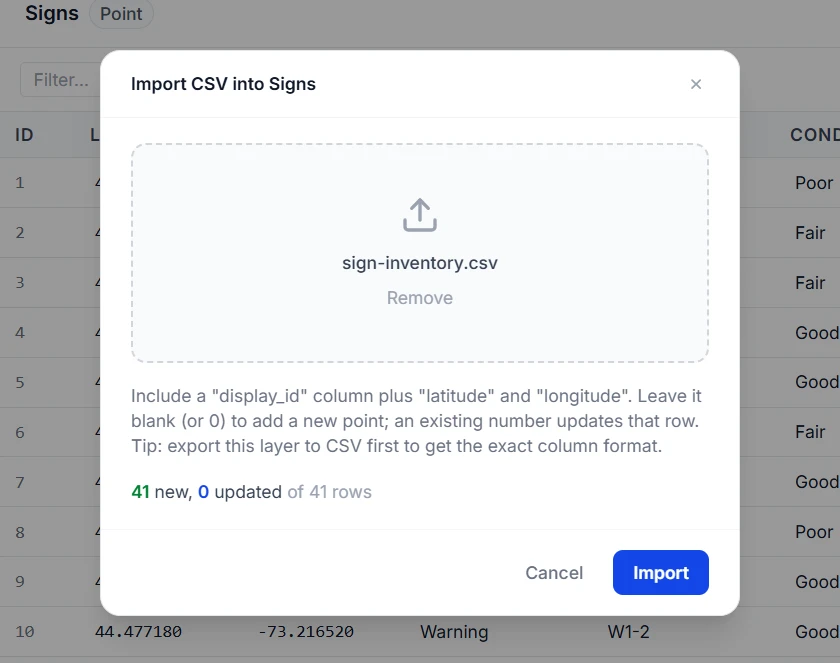
- Make sure the spreadsheet has
latitudeandlongitudecolumns in decimal degrees, and that its other column names match the template. Keep the template’sdisplay_idcolumn and leave it blank: a blank ID tells Rillium Maps the row is a new sign. - Save it as a CSV file.
- On the Data page, open the Signs layer’s table and click Import CSV.
- Check the preview. It shows how many signs will be added and lists any rows with problems, such as a condition that is not one of your three options.
- Click Import.
Write dates as year-month-day, such as 2019-06-14, and leave the cell empty when the install date is unknown. Nothing is imported until the whole file is clean, so a bad row never leaves you with half an inventory.
Add signs in the field
First put the layer on a map. You only do this once:
- Click Maps in the sidebar, then New map, and name it
Sign Inventory. - Open the map, click Layers, then + Add layer, and choose Signs.
Now open the same map on your phone, walk to a sign, and record it:
- Tap Edit, then Add.
- Tap Use My Location to drop the point where you are standing, or tap the map to place it by hand.
- Fill in the form. Check the back of the sign for an install date sticker.
- Open the Attachments tab and take a photo of the sign face.
- Tap Add at the bottom of the form, then Save All.
With the dropdowns doing most of the work, a sign takes well under a minute. Work one street at a time and the map fills in behind you.
Poor signal on back roads? Install Rillium Maps on your phone from the profile menu. Signs and photos you add without signal are saved on the phone and sync when you are back in coverage. The background map itself needs a connection to load, so open the area once before you head out.
See what needs replacing
This is where the map earns its keep over the spreadsheet.
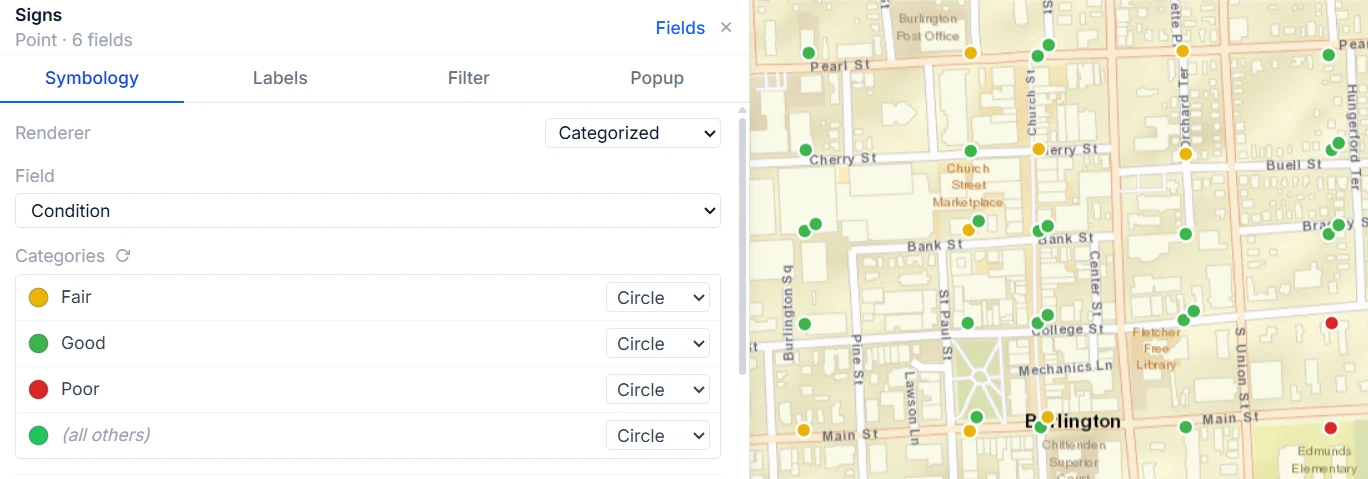
Color signs by condition
- In the Layers panel, click the gear icon on the Signs layer.
- On the Symbology tab, set Renderer to Categorized and Field to Condition.
- Set Good to green, Fair to yellow, and Poor to red, then save the layer settings.
Every Poor sign in town now stands out without opening a single record.
Find signs past their expected life
- In the same layer editor, open the Filter tab.
- Add a condition: Install date is before the cutoff date for your sheeting.
- Add a second condition on Sheeting if your sheeting types have different lifespans.
For example, if you expect ten years from a sheeting type, filter for install dates more than ten years ago. The count at the top shows how many signs match, which is the number to budget for. A second filter for Install date is empty finds the signs you still know nothing about.
What this does not do. Rillium Maps tracks each sign’s age, sheeting, and condition. It does not measure retroreflectivity. If your agency uses the measurement or nighttime inspection method, record those results in the Condition and Notes fields.